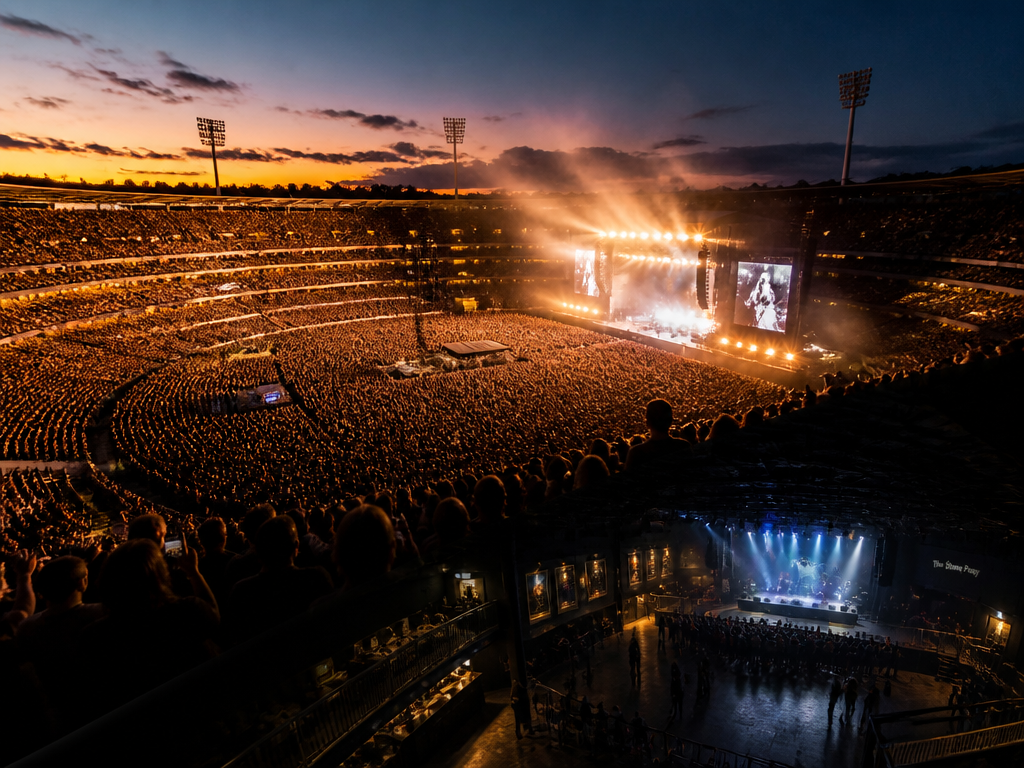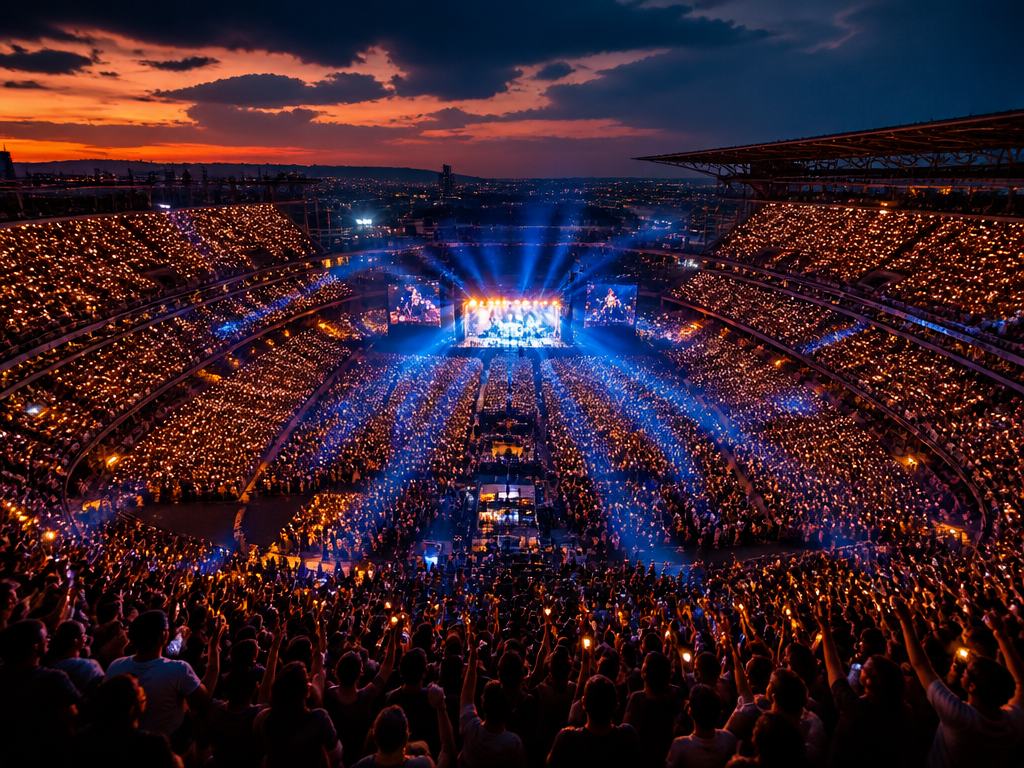
Start with the headline that ran everywhere: music tourism spending in the UK grew by double digits year over year, and the trade press had its lede before the report finished loading. The proof was on the ground and easy to name — Oasis reformed and sold out stadiums, Beyoncé and Coldplay parked residencies in the major cities, and every regional hotel within a train ride of a stadium filled up on show nights. The number felt true because you could see it.
That number — call it the growth figure, because the exact percentage shifts each reporting cycle and you should always check the current one — is the load-bearing wall of nearly every 2025 live-sector strategy deck. If you cover this beat or plan around it, the useful work is not repeating the figure. It is understanding what it measured, and being precise about the parts of the market it was never designed to see.
What the number actually is
The growth figure comes from industry-body reporting — in the UK, that means UK Music's annual economic study, which aggregates ticketing, tourism, and employment data into a single spend total and a single year-over-year movement. The framing in these reports is consistent: a big top-line number, a breakdown into attendance and spending, a jobs figure, and a policy ask from the chief executive at the end. That structure is not an accident. It is built to be quoted in a Parliamentary submission and a newspaper headline on the same afternoon.
So the double-digit growth is real, in the sense that the methodology produced it and the methodology is disclosed. It is also a spend figure, not a profit figure, and not a per-artist figure. Hold that distinction, because most of the misreadings come from collapsing it.
What "music tourism spending" measured
Here is the part that gets flattened in the retelling. The number bundles two very different people into one word.
- Domestic music tourists — people who travelled within their own country to attend a show. This is the large majority of the count, tens of millions of trips, and it captures a lot of "drove ninety minutes and stayed one night" behaviour.
- Overseas music tourists — a smaller headcount but a much higher spend-per-head, because they bought flights, multiple hotel nights, and a week of everything else.
Then the spending itself splits into two buckets that matter enormously if you are the one trying to earn from it:
- Direct spend — the ticket, the merch, the drink at the bar.
- Indirect spend — the hotel, the restaurant, the taxi, the pre-show meal, the second night in the city.
The uncomfortable truth for anyone in the music business specifically: the indirect bucket is usually the larger and faster-growing one. When a report says music tourism spending is booming, a big share of that boom is landing in hospitality and transport, not in the music industry's own accounts. The gig is the reason for the trip. It is not necessarily where the money settles.
The jobs figure works the same way. Those full-time-equivalent roles are a modelled number — spending run through an economic multiplier to estimate employment supported across the whole tourism footprint. It is a legitimate way to size cultural value, and it is the right argument to take to a government that funds by GDP contribution. It is not a headcount of people employed in music. A hotel night porter working because a stadium show sold out is inside that figure.
None of this is a criticism of the method. It is the method doing exactly what it says. The problem is downstream, when the number gets quoted as if it were a verdict on the health of the music industry rather than a measure of the economic weather around live events.
What the number doesn't measure

This is where a coverage or strategy reader earns their keep — by naming the gaps out loud.
It doesn't measure the grassroots. A record year for stadium spend can sit directly on top of a record year for small-venue closures. The two are not in tension in the data because they barely touch the same data. Aggregate tourism spend is dominated by large-capacity events; a 200-cap room shutting down moves the top-line figure by a rounding error while removing a rung from the entire touring ladder. When leadership at these bodies pairs the growth headline with a warning about grassroots venues, that is not throat-clearing. It is them telling you the two numbers live in different rooms.
It doesn't measure artist take-home. Gross spend says nothing about how the money divides between promoter, platform, venue, and performer. A mega-tour year can lift the total while the median touring act runs thinner margins than five years ago, squeezed by fuel, freight, and — for anyone crossing the UK–EU border — post-Brexit carnet and visa costs that turn a modest European run into a loss.
It doesn't distinguish demand from price. Spending is volume times price. If secondary-market touting and dynamic pricing pushed ticket prices up sharply, spend rises even if fewer distinct humans got in the door. Attendance counts help separate the two, but "spending grew" alone cannot tell you whether the market got bigger or merely more expensive.
It is a survivorship snapshot. A year with a once-in-a-decade reunion and multiple stadium residencies is not a baseline. Build a three-year plan on a peak-supply year and you are extrapolating from the top of a wave.
What the figure covers, and what it doesn't
If you're writing this into a deck or a story, this is the distinction worth pasting in:
| The growth figure includes | The growth figure does not isolate |
|---|---|
| Ticket, merch and on-site spend | Profit or margin for any party |
| Hotel, transport, hospitality spend | Money that stays inside the music industry |
| Domestic and overseas attendee trips | Grassroots venue viability |
| Modelled FTE jobs across tourism | Actual headcount employed in music |
| Total market spend | Whether growth came from more fans or higher prices |
The table is not an argument that the number is bad. It is an argument that the number answers one question well — how much economic activity did live music generate? — and gets misused when stretched to answer four others it was never built for.
What this piece didn't answer
I have not told you the current percentage, because it changes with each reporting cycle and you should read it from the source with the year attached, not from a headline that dropped the date. I have not told you how much of this year's growth was reunion-tour anomaly versus durable demand — that requires the next two annual reports to sit beside this one before anyone can honestly say. And I have not told you whether the money reached the people who made the music, because the aggregate spend figure structurally cannot see that, and no single study will hand it to you.
Where to look next, if you need those answers: pull the report's own methodology appendix for the domestic-versus-overseas and direct-versus-indirect split rather than the press summary. Cross-reference the grassroots venue trust's closure tracking against the same year — the gap between the two is the real story. And watch the ticketing regulation consultations, because that is where the question of price-versus-demand will get argued in public, with numbers attached.
A booming spend total and a struggling middle of the industry can be true in the same year. The figure everyone's quoting proves the first. It was never designed to disprove the second.
Not sure which tool to use?
Compare the top AI music and sound tools side by side — honest reviews, real pricing, no sponsorships.