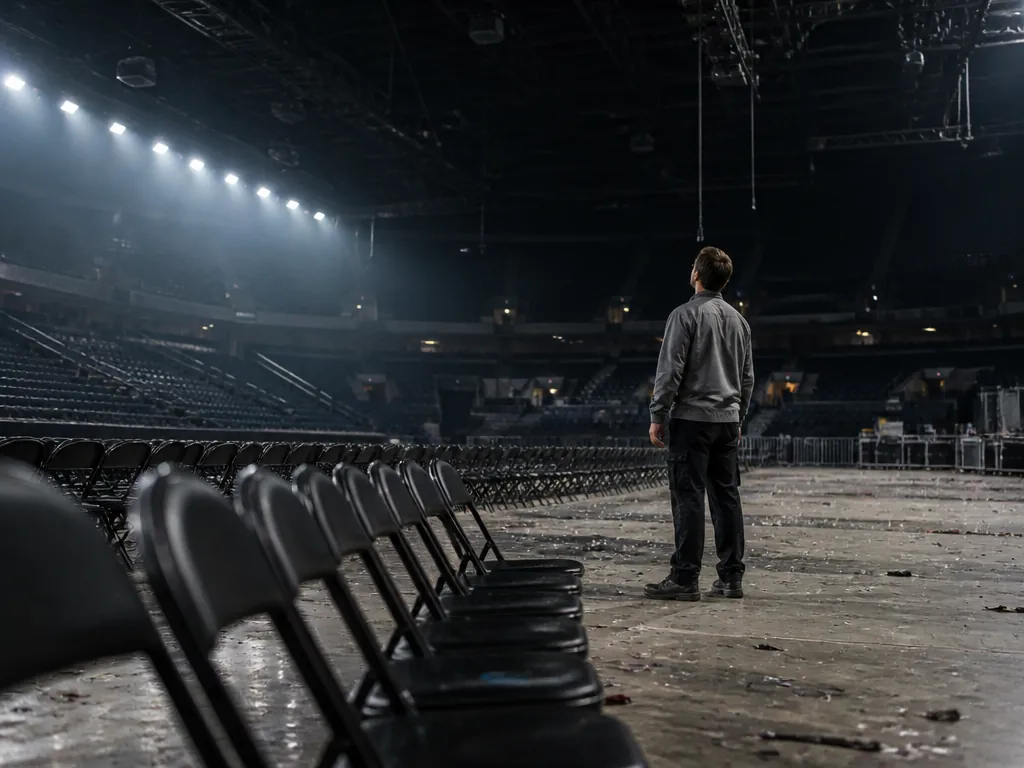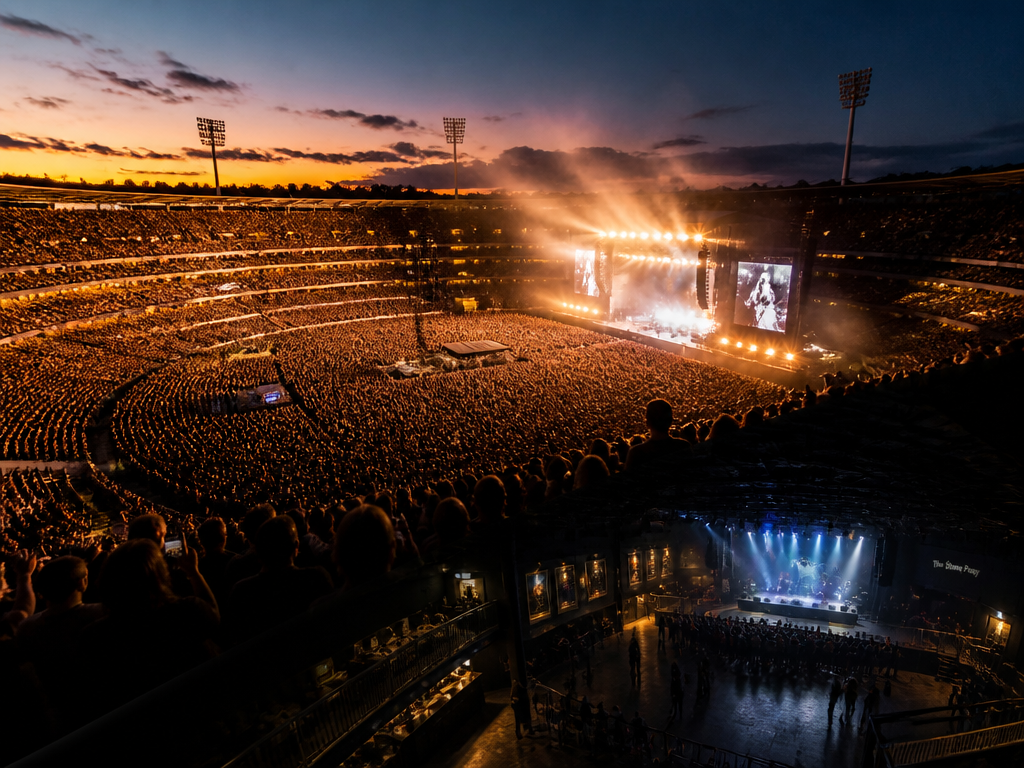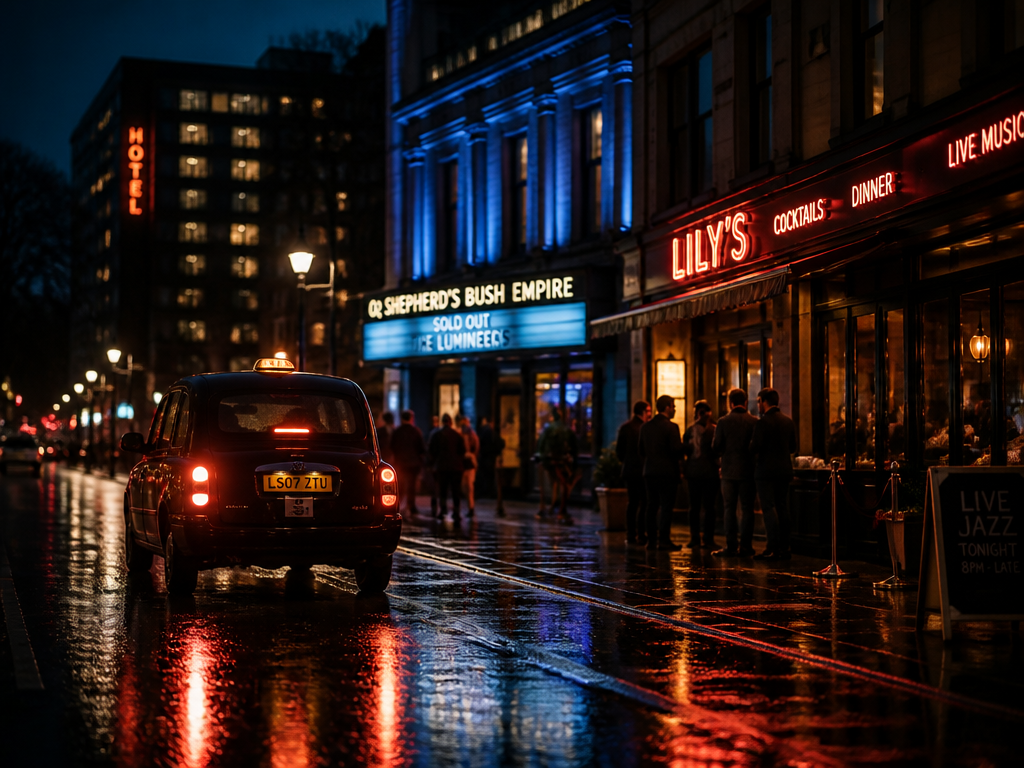
736,000 tickets across a UK and Ireland run, a livestream that reportedly set a platform record, and a press release built to be quoted. What interested me was further down: the streaming analytics from the markets the tour actually visited. Because the industry has a rule about this, and the rule is half folklore. Play the market, the market streams you. Book the run, watch the local graph tilt, credit the run. Some version of that slide has been in every touring deck since around 2015.
The rule is roughly right. It is also right for reasons that are usually not the ones on the slide, and it breaks in places that matter more than the headline number does — particularly if you are the person who has to explain to a label why a heritage act's post-tour listener base looks nothing like the crowd that was in the room.
I came to this from the other side of the glass. I spent a decade writing cues for indie games and short films, and most of what I know about measurement I learned watching a client argue that a trailer's view count proved the music was working. Numbers in music are almost never measuring the thing the person holding them wants them to measure. Tour lift is a good example, because the effect is real and the attribution is a swamp.
Where the rule holds up
Start with the strongest version of the case, because it deserves one.
A tour is the closest thing this business gets to a natural experiment. Nearly every other marketing input a label controls — a sync, a playlist pitch, a paid push, a press cycle — lands everywhere at once, or lands in a pattern nobody outside the platform can see. A tour lands in named cities on named dates. That gives you two things analysts almost never get: a geography you can slice on, and a control group made of every market you didn't route through.
So when reporting on that UK and Ireland run described local streams roughly doubling while the artist's non-touring territories stayed flat, that comparison carries actual weight. It isn't proof, but it's a shape. If the lift had appeared uniformly across every market on earth, you'd be looking at a platform-side event, a catalogue re-push or an editorial add, and the tour would be a coincidence sitting next to it.
The second thing the rule gets right: live is one of the few remaining ways to move a listener from passive to active. A stream from an algorithmic radio session and a stream from someone who paid to stand in a room for three hours are the same row in the export and completely different assets. Monthly active listener growth in touring markets — as opposed to raw stream count growth — is the metric that survives the most scrutiny here, and it's the one worth pulling first.
Does touring actually increase streaming?
Yes, in the markets you play, and mostly for a few weeks either side of the show. The pattern that shows up repeatedly in tour-cycle reporting is a lift concentrated in the cities and countries on the routing, spiking around on-sale and again in show week, then decaying over roughly the following month. What is far less consistent — and what almost nobody publishes — is whether the lift outlives the run. Some cycles leave a permanently higher floor in those markets. Others return to baseline by the next quarter and leave nothing behind but a merch number. The difference between those two outcomes is not the tour. It's what was released into the window the tour opened.
That is the whole argument of this piece, so I'll put it plainly before I complicate it: touring reliably creates attention in a place. It does not reliably create retention. Those are separate line items and the rule collapses them.
The announcement is the event, not the show
Here is the first place the folklore version fails on the timing.
On-sale day is the demand event. It's the day tens of thousands of people search the artist's name, sit in a queue with the artist's name on screen for forty minutes, text three friends the artist's name, and then — while the tab is still open — go listen to something. The show itself is fulfilment. By the time anyone plays a note, months have passed and the person who bought the ticket has already had their listening spike.
If you anchor your attribution window on show dates, you will systematically under-count the announcement and over-count the gig. Worse, you'll brief the campaign wrong: you'll hold the single for show week when the largest concentration of newly-curious searches happened on a Friday morning in a ticketing queue five months earlier.
There's usually a second, smaller peak in show week and a third that lands after the last date, driven by footage rather than by anyone who attended. That third peak is the interesting one and I'll come back to it.
Catalogue depth decides where the lift lands
The second break: the rule treats "streams" as one pool. It isn't, and which pool fills tells you what kind of act you're looking at.
A legacy act with a twenty-five-year catalogue gets a lift distributed across a back catalogue, weighted toward the four songs everyone knows and the two that the setlist reactivated. That's genuinely valuable — reactivated catalogue is high-margin and it compounds into algorithmic surfaces — but it is not audience development. It's revenue from an audience you already had, plus some number of new people who arrived at the same four songs.
A developing act with two EPs gets something different: a lift concentrated on one or two tracks, usually the one that had a moment in clip form, and a follower number that either moves or doesn't. For a new act the follower conversion is the real read. Streams without follows in a market you played means people heard it, liked it enough not to skip, and did nothing to make it happen again.
Same tour mechanic, two entirely different diagnostic questions. A dashboard that reports "tour markets up 104%" for both is telling you almost nothing about either.
The finding that reframes the whole exercise
Now the part that actually earns the reporting.
In the case that started this, the post-tour listener base for a group whose first hits predate most streaming accounts reportedly skewed heavily young — a substantial share under 35, on a campaign's own analysis. Take the exact figure with the appropriate amount of salt; more on that below. But the direction is the finding, and the direction is not what the room looked like.
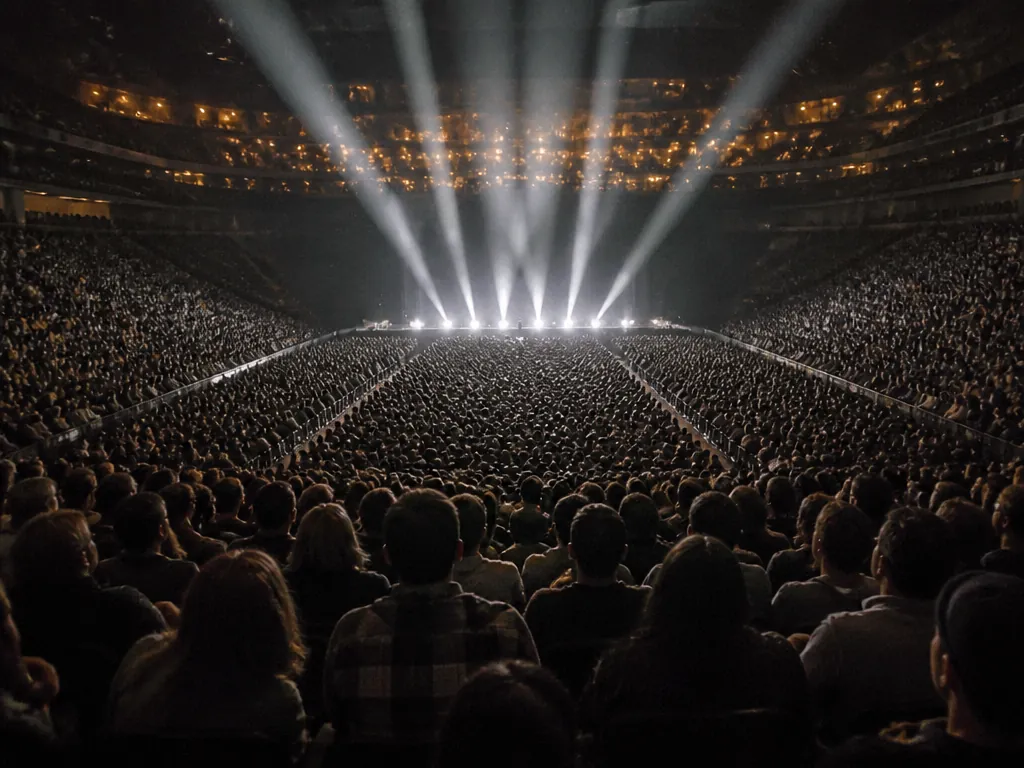
Think about what that implies. The people in the venue were, broadly, the people who have been in that venue for two decades. The people who showed up in the listening data afterward were, in meaningful part, people who were not in the room and in many cases were not alive for the first album cycle. They did not experience the tour. They experienced footage of the tour.
That flips what a tour is on the balance sheet. A tour is not primarily a live-revenue event with a marketing halo. For catalogue acts it is increasingly a content-production event with a ticketed audience attached — thirty-odd nights of footage generated at scale, in a market that already cares, with a crowd doing the emotional labour of proving the songs still land.
And that reframing has a consequence A&R should sit with: the age skew of a catalogue is more movable than the industry assumes, and the lever is not the record. It's the clip.
What makes a live clip travel
This is the part I actually know something about, so let me be specific, because "post more content" is not a strategy and everyone knows it.
The clips that move catalogue are almost never the clean single. Watch what circulates from any large tour and it's the same handful of shapes:
- The crowd carrying a line unaccompanied. Thousands of voices with no instrumentation is enormously compelling on a phone speaker, because a crowd singing in unison is a wide, slightly detuned choral source with heavy natural reverb, and it survives phone-mic compression better than a full mix does. A stadium PA mix through a handset is a mush of 200Hz and cymbal hash. Voices are mostly 300Hz to 3kHz, which is exactly where a phone speaker lives.
- The moment before the drop, not the drop. Anticipation reads on a small screen. Payoff needs headroom the phone doesn't have.
- The key change, the a cappella intro, the false ending. Structural surprises are legible in eight seconds. Production quality is not.
- Something going slightly wrong. A dropped in-ear, a laugh, a re-start. Imperfection is the authenticity marker that separates footage from an ad.
If you want a rule of thumb for a social team: the hook needs to resolve inside the first eight seconds, the recognisable transient needs to be inside the first second, and the audio should be checked on an actual handset speaker rather than in a room with a monitor controller. A clip that fails on a phone fails, whatever the waveform says.
One practical trap for the teams cutting this material: recap reels and behind-the-scenes edits that use the artist's own master will sometimes catch a Content ID claim anyway, because the rights registration on the recording and the entity uploading the video are different lines in a database that don't know about each other. It's an administrative problem, not a legal one, but it can sit on a reel for a week during the exact window you needed it live. It's a large part of why social teams keep a library of original, cleared beds for the non-performance material — that's a chunk of what City of Punk exists to cover, and any tool that gives you a clean 48kHz WAV with terms you can read in one sitting will do the job.
A measurement set that survives scrutiny
If you have to defend a tour-lift claim to someone who isn't inclined to believe it, here's what each number can and can't carry.

| Metric | What it can support | What it can't |
|---|---|---|
| Local stream lift vs non-tour markets | That something happened where you routed | That the shows caused it rather than the campaign around them |
| Monthly active listeners in tour markets | Genuine audience expansion, not repeat plays by existing fans | Whether those listeners persist past the next quarter |
| Follower / library adds by market | Intent to hear it again — the strongest retention proxy you get | Anything about revenue value of that listener |
| Playlist adds during the window | That editorial noticed | That the tour is why; editorial reads the same charts you do |
| UGC video volume and sound-page creations | That the footage travelled independently of paid spend | Which clips converted to listening |
| Age and territory splits from DSP dashboards | A directional read on skew | Precise demographics — see below |
| Ticket-buyer to listener overlap | Direct causal evidence, the good stuff | Nothing, if you don't have matched first-party data, which most campaigns don't |
The row that matters most is the last one, and it's the row that's usually empty. Ticketing data and streaming data live in separate companies with separate incentives, and without a matched identity layer, everything above it is correlation with a good story attached.
Where the data gets thin
Four caveats, in rough order of how much they should worry you.
You don't know the paid component. Almost no published tour-lift case study discloses what was spent on paid social, influencer seeding, or DSP marketing during the same window. If a campaign ran a substantial creator programme alongside the run, the clips didn't travel — they were driven, and the tour was the raw material rather than the engine. That distinction changes the budget recommendation entirely and it is nearly always absent from the writeup.
Recommenders amplify their own inputs. A track that starts rising gets pushed harder by algorithmic surfaces, which makes it rise further. By week three you are measuring a feedback loop, not a tour. The honest framing is that live events supply the initial displacement and the platform decides how much it echoes — and the echo is frequently larger than the shove.
Age data is account-holder data. This one gets glossed over constantly. Streaming demographic dashboards report the age attached to the account, not the age of the person in the room with the speaker. Family plans, shared logins, a teenager on a parent's subscription, and a signup form filled in creatively at age fourteen all push in different directions. Directionally the skew is still informative. Treat any specific percentage as a wide band, and be especially careful before restructuring a marketing plan around a single-digit shift.
Nobody publishes the flat one. Every tour-lift case study you have read was released because it worked. The tours that moved nothing don't get a writeup, which means the published base rate is not the real base rate. When you benchmark a campaign against these numbers you are benchmarking against a survivorship-filtered sample. Adjust downward before you promise anything.
What an A&R can act on
Strip the caveats out and there's still a usable position, which is the point of doing the work.
Instrument the run before it starts. Baseline every market on the routing and a matched set you're not visiting, at least eight weeks out, on active listeners rather than streams. Anchor your primary window on on-sale, not on show dates. Have a capture plan for footage that treats the crowd as the instrument, and have cleared beds ready for the non-performance material so nothing sits in claim limbo during the window you paid for.
Then treat a younger post-tour skew as a hypothesis, not a discovery. If the audience analytics say the catalogue reached a demographic that wasn't in the venue, the test is cheap: a targeted release, a reissue, a feature, something aimed at that cohort in the specific markets where the shift showed up. If the cohort is real, it converts. If it was an artefact of account-holder ages and one clip that overperformed for a fortnight, you'll know inside a cycle, and you'll have spent a fraction of what a routing decision costs.
What you shouldn't do is put the demographic split in a deck as an achieved outcome. It's an observation about who was listening in a window, from a dashboard with known blind spots, during a period when other things were also happening.
The honest version of the rule
So: not "a tour lifts your streams in the markets you play."
Closer to this. A tour concentrates attention in a place for a few weeks, and manufactures a month of footage in front of a crowd that makes the songs look worth caring about. The attention converts into listening if something is released into it. The footage reaches people who were never going to buy a ticket — and that second group is where audience expansion actually comes from. The show is the raw material. The edit is the product. The measurement should follow the edit.
Which brings me back to 736,000. That number is a fulfilment figure: it counts people who were already convinced enough to pay, in territories where the act was already established. It's a fine number and it belongs in the trade press. It is not the number that should change how anyone plans a cycle.
The number worth putting in the deck is how many of the new listeners never held a ticket at all.
Not sure which tool to use?
Compare the top AI music and sound tools side by side — honest reviews, real pricing, no sponsorships.